Tracking the Storm: How to Read the Current Weather Radar USA Map for Real-Time Insights
The current weather radar USA map is a critical tool for anyone tracking storms in real time, whether you're planning a commute, monitoring travel conditions, or assessing potential risks. With storms developing rapidly across different regions, understanding how to interpret these maps can save time, reduce uncertainty, and help you make safer decisions. This guide breaks down the essentials of reading the radar, what the colors and patterns mean, and how to use this information in practical ways.
Why the Current Weather Radar USA Map Matters Now
Storms in the U.S. can intensify quickly, moving from light rain to severe thunderstorms or even tornadoes within hours. The current weather radar USA map provides a snapshot of precipitation intensity, storm movement, and potential hazards. Unlike older static maps, modern radar systems update every few minutes, offering near real-time data. This immediacy is especially valuable for emergency preparedness, aviation, and infrastructure planning, where delays can have significant consequences.
Decoding the Radar: What the Colors and Patterns Really Show
Radar maps use color gradients to indicate precipitation intensity, from light blue (light rain) to deep red or purple (heavy rain, hail, or potential tornadoes). Green often signals light to moderate rain, while yellow and orange indicate heavier downpours. The key is to look beyond the colors and examine the storm’s structure. For example, a hook-shaped echo on the radar can signal a rotating supercell thunderstorm, which may produce tornadoes. Understanding these patterns helps differentiate between nuisance rain and life-threatening conditions.
Trade-Offs: Speed vs. Accuracy in Storm Tracking
While radar provides near-instant updates, it has limitations. Radar beams can overshoot low-level storms, especially in mountainous regions, leading to gaps in coverage. Additionally, the map’s resolution may not capture small but intense storms, like microbursts or localized hail. For this reason, meteorologists often combine radar data with satellite imagery and ground reports to refine forecasts. As a user, balancing speed and accuracy means cross-referencing multiple sources—such as the National Weather Service’s alerts—before making decisions.
Practical Steps to Use the Radar Map Effectively
Start by identifying your location on the map and tracking the storm’s direction using the velocity data (often shown as arrows or streaks). If the storm is moving toward you, check the estimated time of arrival (ETA) and intensity trends. For commuters, this could mean leaving earlier or taking an alternate route. For outdoor workers, it might signal the need to pause operations. Always prioritize official warnings over general radar trends, as radar alone doesn’t account for localized hazards like flash flooding or downed power lines.
When the Radar Isn’t Enough: Supplementing with Local Insights
Radar maps excel at showing large-scale storm systems, but they can miss subtle, ground-level changes. For instance, urban heat islands or coastal breezes can alter storm behavior in ways radar doesn’t capture. Local news stations and weather apps often provide micro-forecasts tailored to your city or neighborhood, filling these gaps. Additionally, community-based tools like storm spotter networks or traffic cameras can offer real-time visual confirmation of conditions on the ground.
Setting Realistic Expectations for Storm Tracking
No tool is foolproof, and the current weather radar USA map is no exception. Storms can shift direction suddenly, and radar updates may lag slightly behind real-time conditions. To avoid overreacting, focus on trends rather than single snapshots. If a storm’s intensity is decreasing over time, the risk may diminish. Conversely, rapid intensification—visible as a tightening of the radar’s reflectivity gradient—warrants immediate attention. Pairing radar data with a weather app’s push notifications can help you stay ahead of changes without constant monitoring.
Next Steps: How to Stay Ahead of the Storm
Bookmark the National Weather Service’s radar page or a trusted weather app for quick access. Enable location-based alerts to receive notifications when severe weather threatens your area. If you’re responsible for a team or family, designate a point person to monitor updates and communicate changes. For professionals in logistics, construction, or event planning, consider subscribing to specialized weather services that provide tailored forecasts and impact assessments. The goal isn’t to eliminate risk entirely but to reduce uncertainty and act decisively when it matters most.
הקמת גשר דחיקה מעל כביש 6 בפרויקט מסילת 431 - רכבת ישראל - YouTube

הקמת גשר דחיקה מעל כביש 6 בפרויקט מסילת 431 - רכבת ישראל - YouTube
גשר מספר 6 (חיבור כביש 4 לכביש 1) - Gash
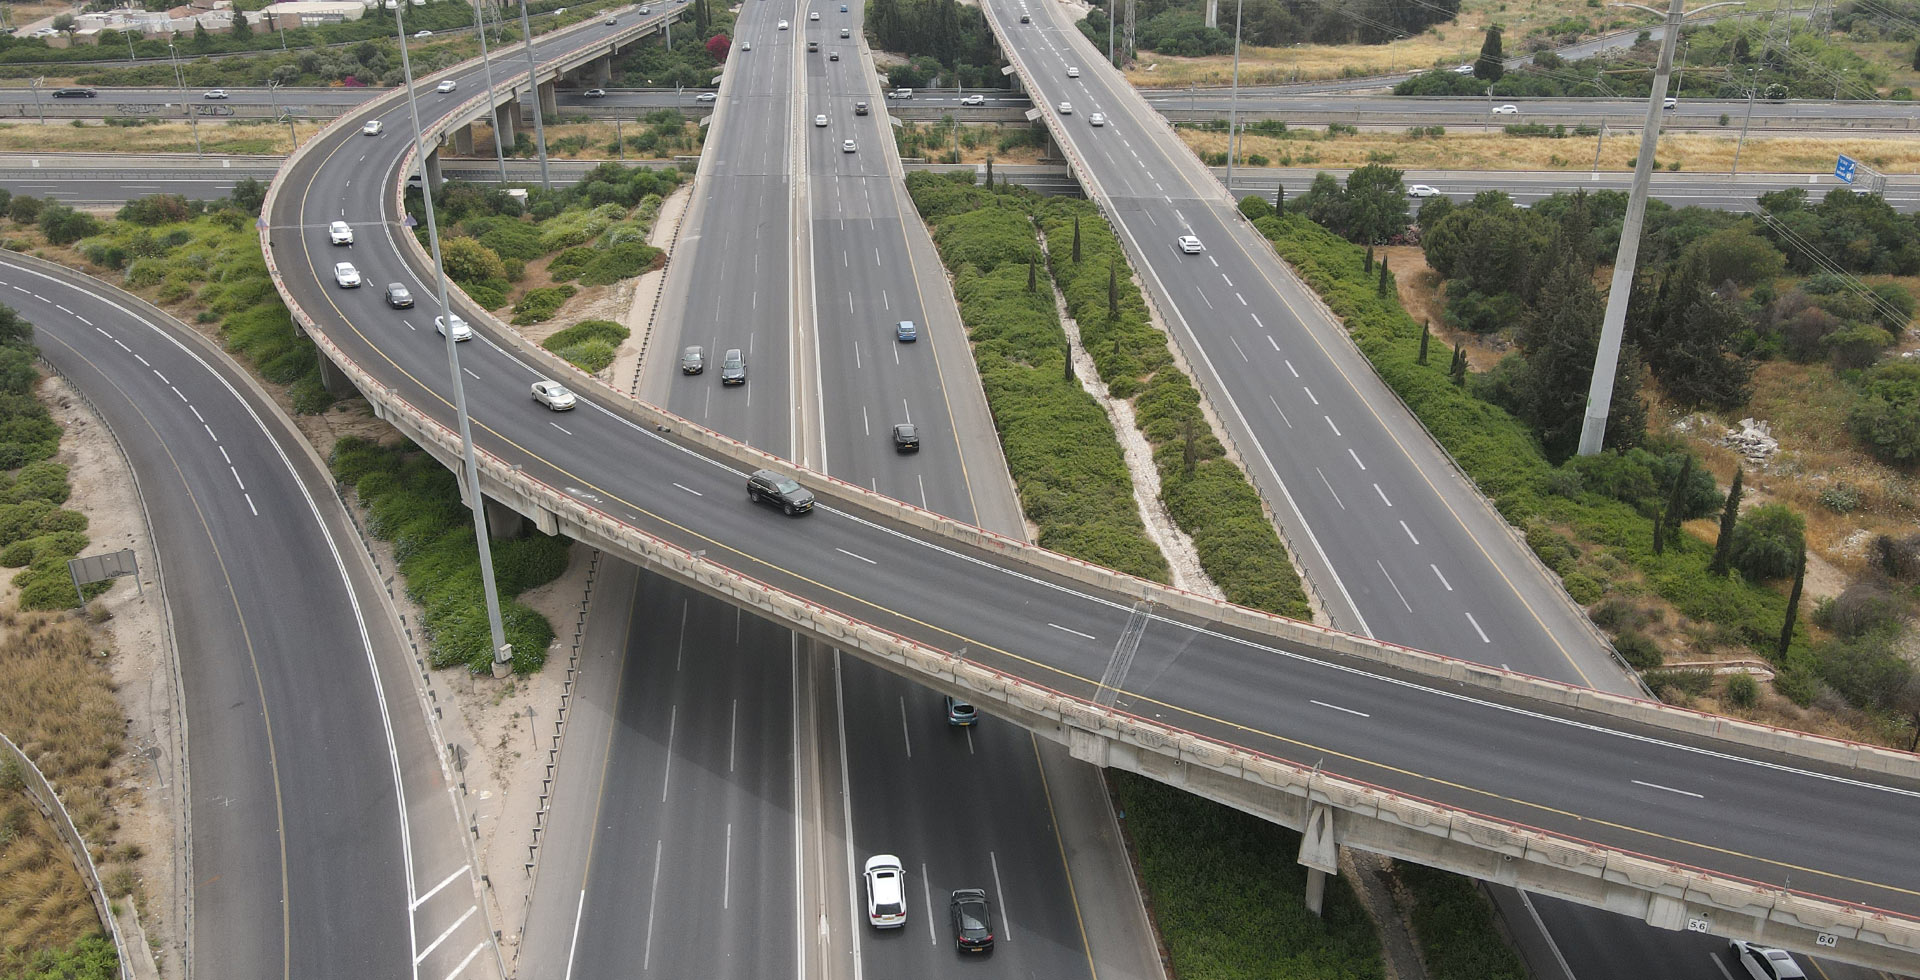
גשר מספר 6 (חיבור כביש 4 לכביש 1) - Gash
פרויקט נתיבים מהירים: חסימה הרמטית בכביש החוף הנפת גשר חדש להולכי רגל
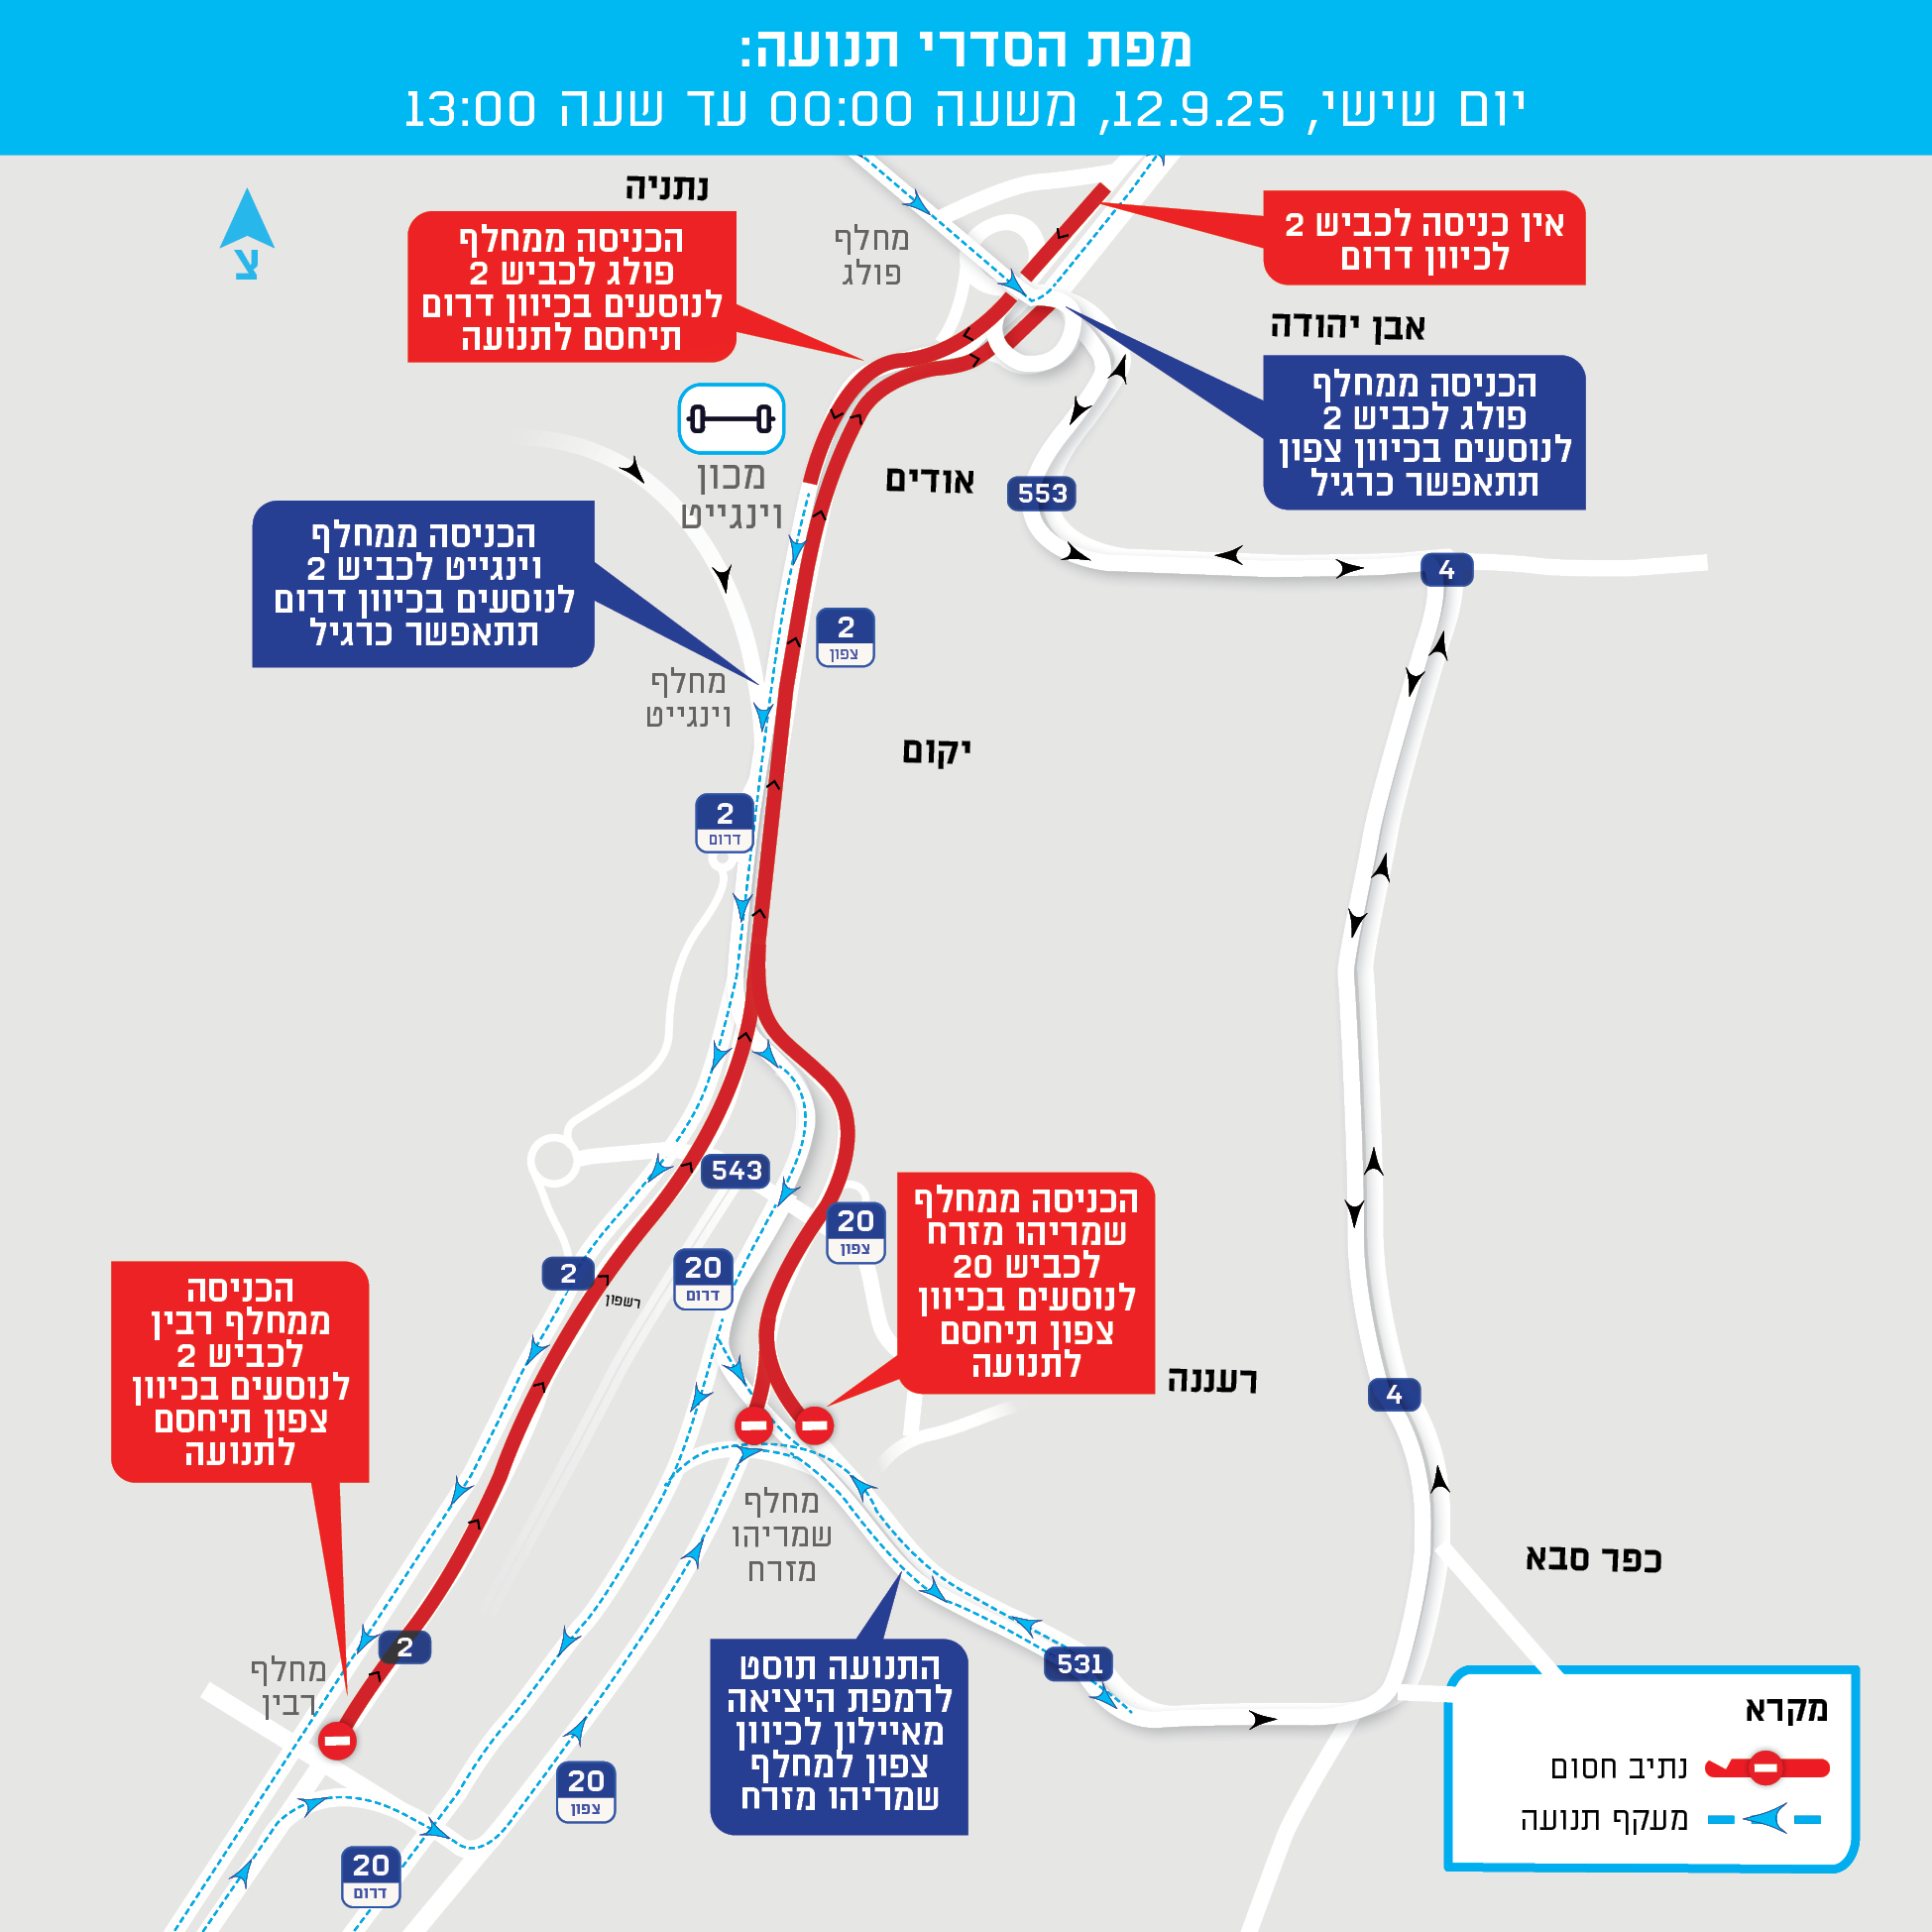
פרויקט נתיבים מהירים: חסימה הרמטית בכביש החוף הנפת גשר חדש להולכי רגל ...
פרויקט נתיבים מהירים: עבודות להתקנת גשרי שילוט לאורך נתיבי כביש החוף (2
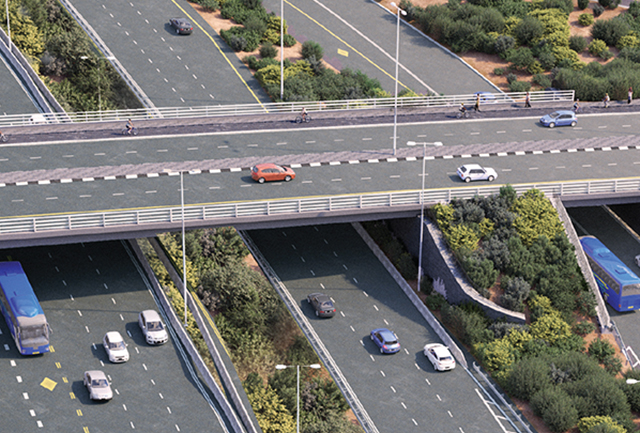
פרויקט נתיבים מהירים: עבודות להתקנת גשרי שילוט לאורך נתיבי כביש החוף (2 ...